
 Shipping OS
Connected capability
Find what moved performance and where to look next.
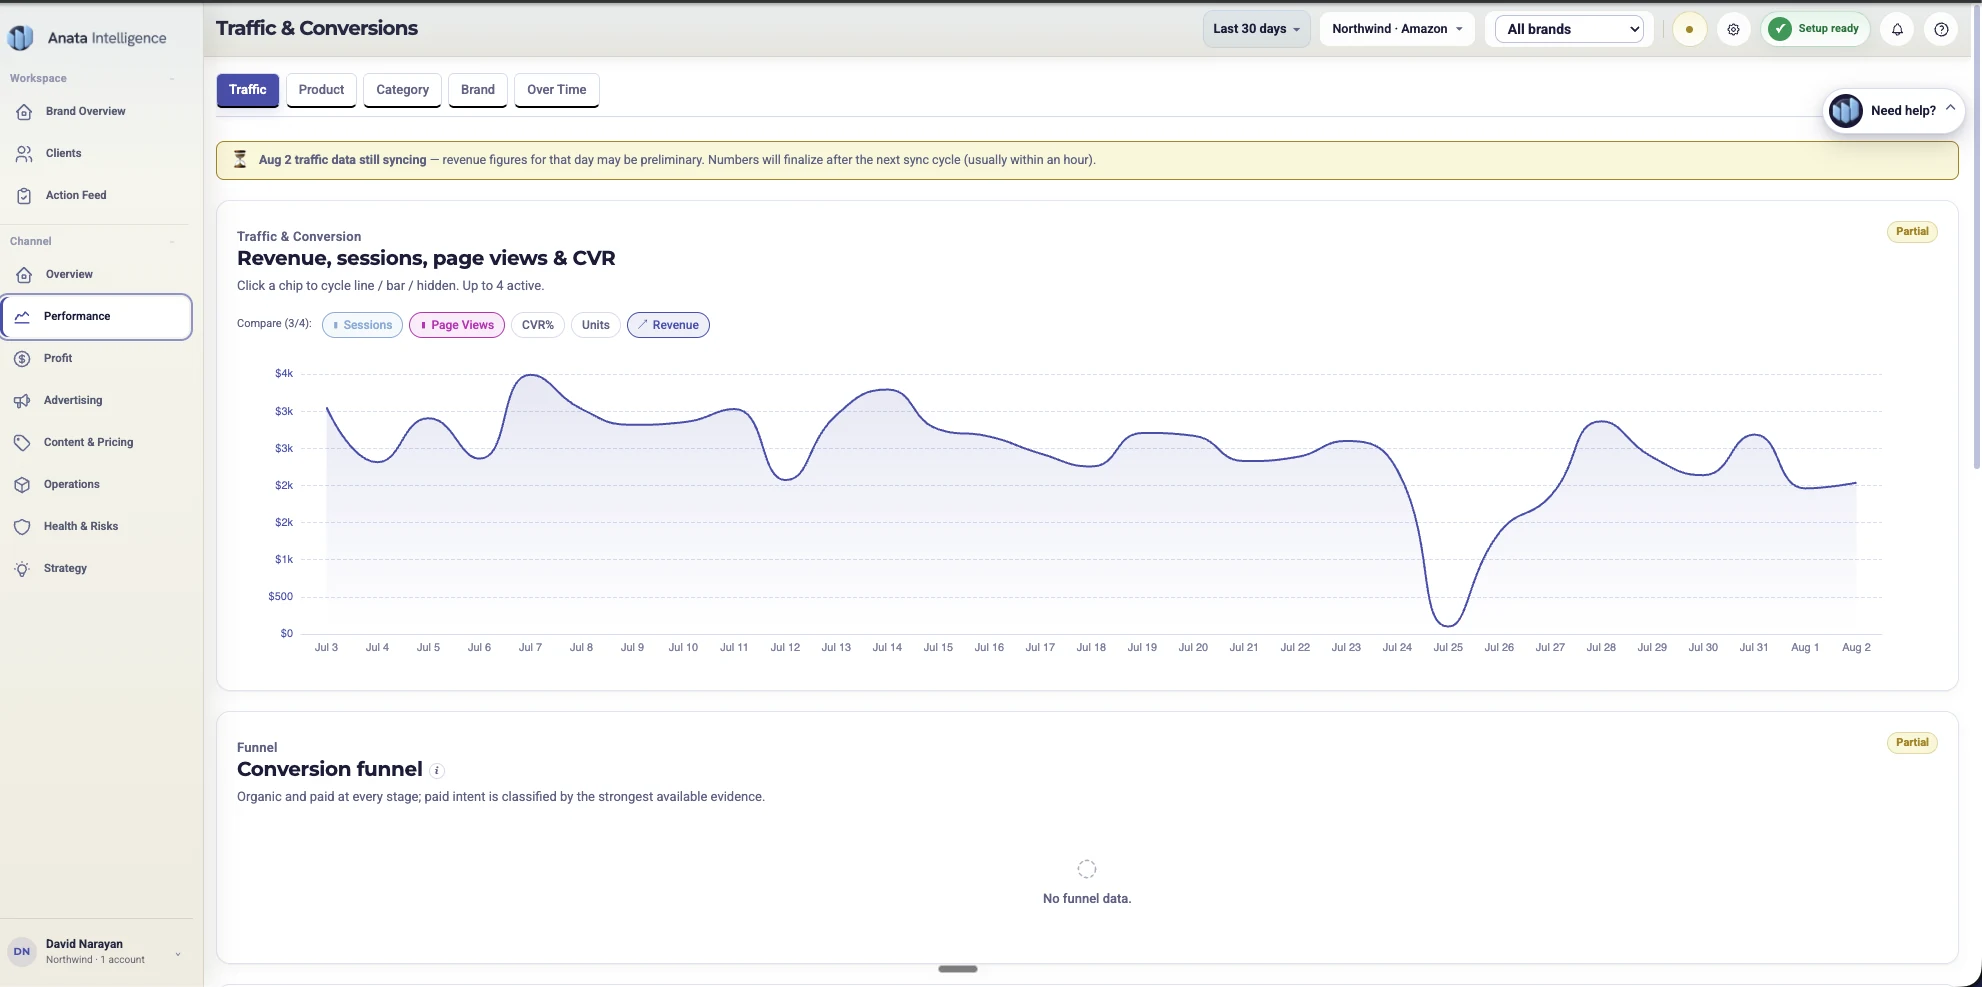
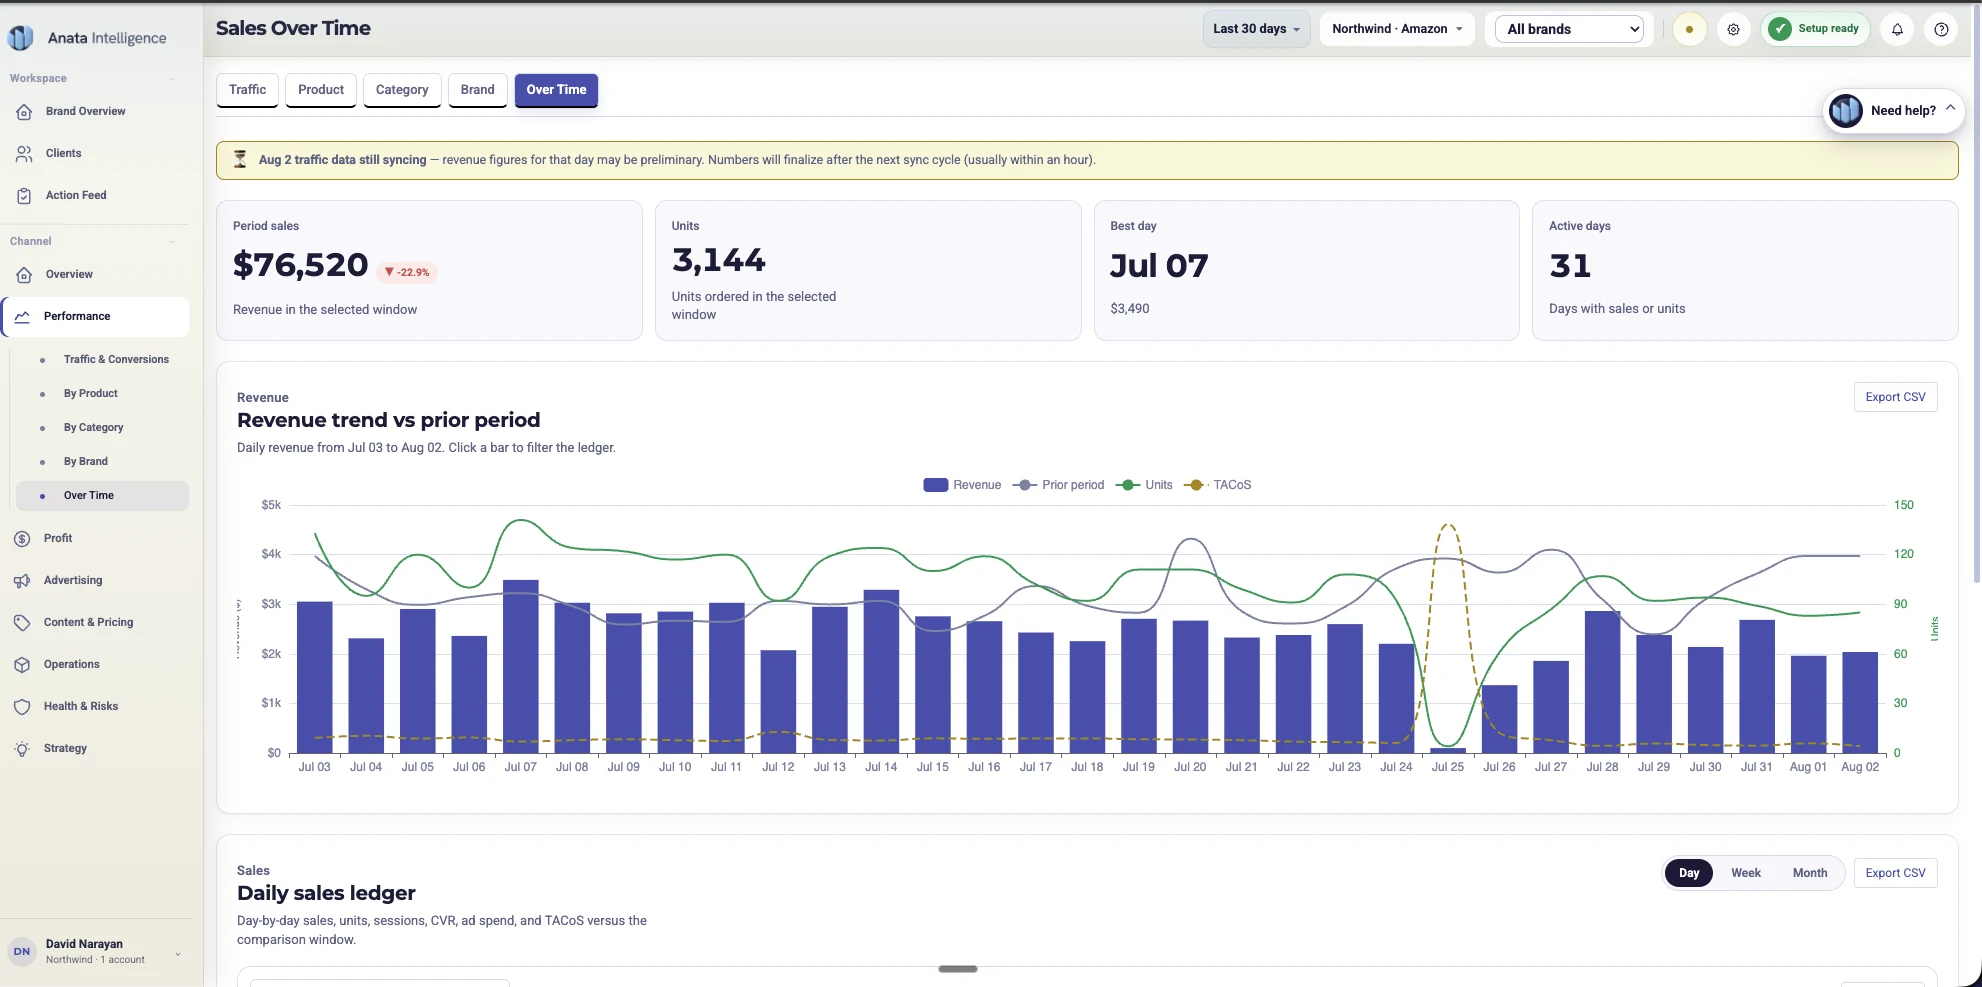
Compare performance, find the products behind a change, and open the workflow that needs attention next.
Explore PerformanceUnderstand performance, decide what needs attention, and carry the work into advertising, content, inventory, profit, and account health. Every workflow uses the same working context.
One connected system
Select a capability to see its role, then open the full workflow when you need the details.
Connected capability
Compare performance, find the products behind a change, and open the workflow that needs attention next.
Explore PerformancePerformance
Compare performance, find the products behind a change, and open the workflow that needs attention next.
Amazon Ads Automation
Review how Anata qualifies bid, budget, search-term, targeting, and campaign-coverage work, then keeps higher-risk changes behind approval.
Inventory Operations
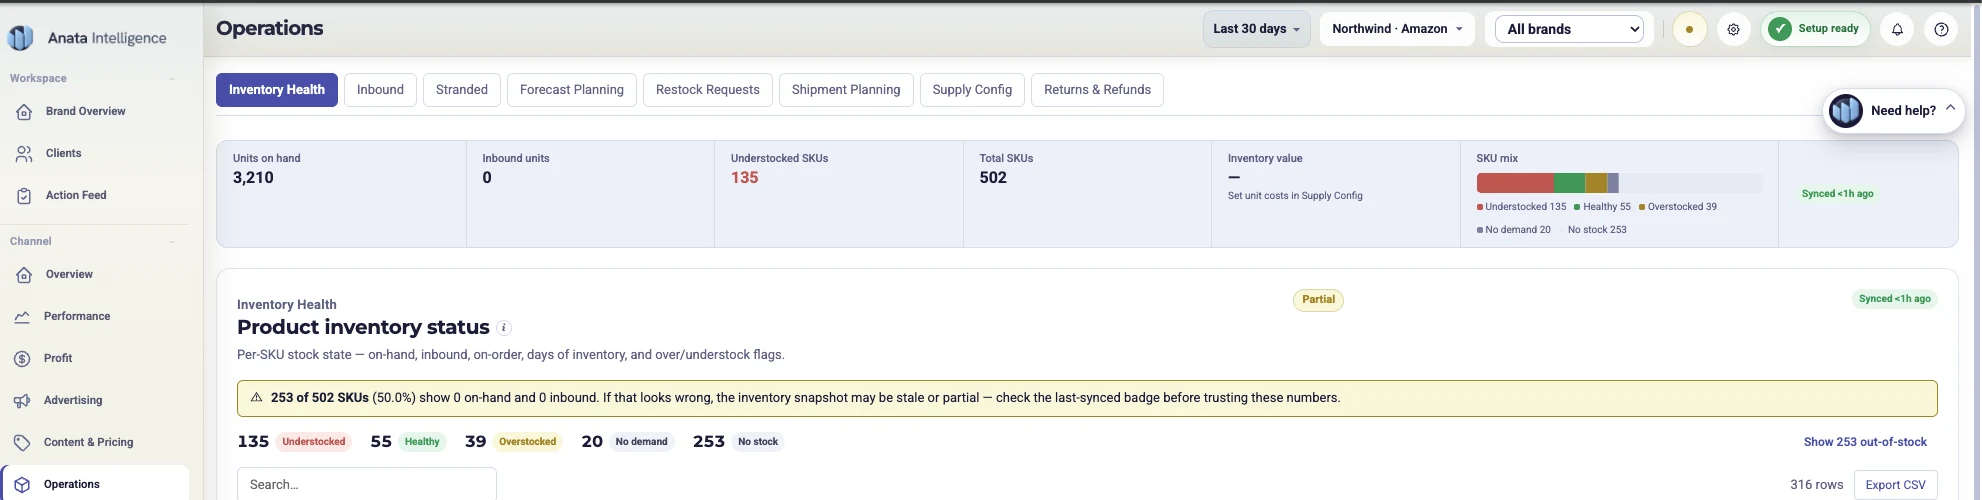
Prioritize replenishment and resolve the inventory exceptions most likely to put the next sale at risk.
And the rest of the system
Create coordinated copy, imagery, A+ Content, storefront modules, and ad creative from one shared brief.
See contribution by product and use real economics to guide advertising and investment decisions.
Track account risk, case ownership, supporting evidence, and the next response in one durable record.
Give every product a clear goal, order the work, and update the plan as results and constraints change.
Start with a supported billable channel, then add available data and service tools for the workflows that need them.
Pricing
Intelligence access follows how you work: included for Anata-managed clients, available as a paid brand plan, or configured across a multi-brand portfolio.

Anata Intelligence
Choose Brand for one brand in one workspace. Choose Portfolio to manage multiple brands or client workspaces from one account.
Try your selected plan for 14 days. No card needed to start. Your trial starts when your first supported data channel is verified and connected. If you subscribe during the trial, your first charge is due at its original end.
New subscriptions currently support Amazon Seller Central and Meta Ads. Shopify and other channels are not yet available for new subscriptions. Channel allowances are maximum capacities, not a promise that every integration is available. Enrollment opens in limited groups.
With fewer than 48 hours left in your trial, wait until it ends to complete a subscription. Connecting a service tool does not start your trial. Reconnecting the same channel or adding another workspace does not restart it.
Credit-priced image generation and audit actions show their credit cost before you confirm. Credits are reserved when work starts and cannot be spent twice. Other AI features remain subject to their availability and usage limits; a plan does not promise unlimited AI work.
Your trial includes one full selected-plan allowance for the 14 days. Paid allowances renew monthly, including on annual plans. Unused included credits do not roll over.
brand
$99 / month
Start with one connected brand.
For a brand building a reliable operating view without paying for portfolio capacity.
Most flexible
brand
$199 / month
Turn visibility into action.
For a growing brand coordinating more channels, teammates, and AI-assisted work.
brand
$399 / month
Run a larger brand operation.
For an established brand with a broader channel mix and higher AI usage.
Recommended starting point
Brand Growth
A balanced starting point with 4 channels, 5 seats, and 500 monthly AI credits.
Prices in USD; taxes may apply. Annual plans are charged once per year, with monthly AI allowances. No automatic charge without subscription consent and no automatic overage charges. When you reach a limit, upgrade before additional usage. Managed marketing services are separate.
Available with an active Anata management engagement. Your Anata operators and your team work from the same evidence and decisions.
Talk to the teamBrand count, permissions, and onboarding are configured together.
Choose Portfolio planIntelligence account creation is separate from Shipping OS. New accounts choose a plan, then connect an available first channel in their workspace.

From signal to decision
Channel, date range, comparison period, freshness, and data readiness stay visible as the operator moves from trend to detail.
Run it your way.
Run the software yourself or put Anata in the operating seat.
Before you start
Anata Intelligence connects performance, advertising, listing, operations and profit evidence to product-level decisions. The useful answer depends on the account data available and the scope of access you provide.
Start with the data required for the decisions you want to make.
Review data connections