

Amazon customer analytics without a data team: the simple funnel that shows what to fix next
If you sell on Amazon, you already have a funnel. Customers discover your Storefront and product pages, decide whether to buy, and then decide whether to come back. The problem is not that the funnel is complicated. The problem is that most brands track it in fragments: ads in one place, traffic in another, and repeat purchases as a vague feeling.
This post lays out a simple, practical model for amazon customer analytics that you can run without a data team. You will map three stages:
- Storefront and listing discovery (who is finding you and from where)
- Purchase conversion (who is buying and what it costs to win the sale)
- Repeat purchase (who comes back and which products create loyalty)
You will also see exactly which Amazon reports to use, how to turn them into a weekly dashboard, and how to connect insights to actions like creative updates, pricing tests, PPC changes, and fulfillment improvements.
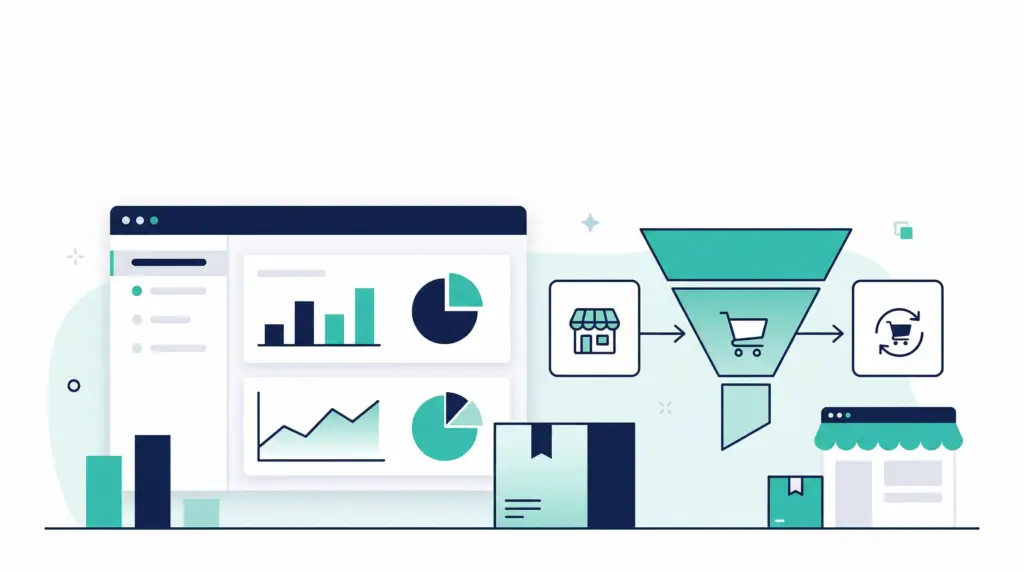
The simple Amazon funnel: Storefront to purchase to repeat
When you simplify the funnel, you simplify decisions. Here is the three-stage view we use with brands that want clarity fast:
- Storefront and listing discovery: shoppers see your brand in search, ads, or external channels, then land on a Storefront, a product detail page, or both.
- Purchase: shoppers add to cart and complete an order.
- Repeat: a share of buyers come back for a second order, often within a replenishment cycle.
The value of this model is that it creates a clean set of questions:
- Are we getting enough qualified discovery, or are we invisible?
- Are we converting the traffic we already have, or leaking revenue?
- Are we building a brand, or renting one-time buyers?
Stage 1: Storefront and listing discovery metrics to track
Discovery is where most Amazon brands over-index on one metric, usually impressions, and miss the real issue. You need to break discovery into two buckets:
- On-Amazon discovery: organic search, Sponsored Ads, and on-Amazon placements.
- Off-Amazon discovery: social, email, influencer, paid search, and any link you control.
On-Amazon discovery: use Brand Analytics to see search behavior
Start with the queries that drive your category. In Amazon Brand Analytics, Search Query Performance helps you see how shoppers interact with your brand across search. Your goal is not to memorize every number. Your goal is to spot gaps like: high impressions but low clicks (creative mismatch), or high clicks but low purchases (listing conversion issue).
Weekly actions tied to the data:
- If impressions are high but clicks are low, improve your main image, title clarity, and price positioning before you raise bids.
- If clicks are high but purchases are low, audit your listing content, reviews, variation structure, and shipping promise.
Off-Amazon discovery: measure with Amazon Attribution
Many brands run external traffic and never connect it to outcomes. Amazon Attribution exists for this exact reason. Amazon explains that Amazon Attribution is a free measurement solution that helps you understand how non-Amazon marketing drives discovery and purchase on Amazon, and its reports use a 14-day attribution window with engagement and conversion metrics available in the console and downloadable reports (Amazon Ads).
Attribution reporting includes engagement metrics like clicks, detailed page views (DPV), and detailed page view rate (DPVR), plus conversion metrics like add-to-cart, purchases, units sold, product sales, and new-to-brand (Amazon Ads).
How to use this in a simple funnel: treat each external channel as a discovery source, then judge it by whether it creates qualified traffic. Qualified traffic is traffic that reaches a detail page and adds to cart at a reasonable rate, not just clicks.
Stage 2: Purchase conversion metrics that actually diagnose problems
Conversion is where your profit is made or lost. The key is to separate listing conversion from ad conversion. A listing can convert well while ads look weak due to broad targeting, and ads can look strong while the listing is underperforming if the traffic is unusually warm.
Listing conversion: sessions, unit session percentage, and detail page rate
In Seller Central, unit session percentage is the classic listing-level conversion indicator. Track it weekly for your top ASINs and your hero variations. When conversion drops, look for leading indicators:
- Review rating changes and recent negative themes
- Price changes relative to competitors
- Stockouts, suppressed buy box, or longer delivery promises
- Creative changes that reduced clarity on mobile
Simple benchmark thinking: do not chase “average” conversion. Compare your ASINs to each other, and compare your current period to your own baseline. The biggest wins often come from lifting your bottom quartile listings, not squeezing one more percent out of your best seller.
Ad-driven conversion: click to purchase efficiency
Paid traffic needs its own lens. Use Sponsored Products and Sponsored Brands reporting to track:
- CTR for creative relevance
- CPC for auction pressure
- CVR for alignment between keyword intent and listing
- ACOS for efficiency against your margin targets
If your ACOS is high, do not immediately cut spend. First ask: is it a targeting problem, or a listing problem? If the traffic is relevant and conversion is still weak, fix the listing and fulfillment promise before you shrink reach.
New-to-brand: confirm whether you are expanding demand
New-to-brand (NTB) reporting helps you understand how much of your ad-attributed sales come from first-time customers. Amazon notes that campaign reporting includes new-to-brand metrics that analyze engagement from first-time customers and help visualize the impact of ad-attributed purchases (Amazon Ads).
In funnel terms, NTB tells you whether your discovery efforts are bringing fresh buyers into the brand or just recapturing existing demand. Both can be valid. The key is to decide intentionally based on your growth phase.
Stage 3: Repeat purchase analytics that turn one-time orders into a brand
Repeat purchases are where you earn the right to scale. If your product is replenishable, repeat rate is the whole game. If your product is not replenishable, repeat still matters because it is the best signal that your brand story, packaging experience, and product quality are aligned.
Use the Repeat Purchase Behavior report as your retention baseline
Amazon Brand Analytics includes a Repeat Purchase Behavior view that helps brands quantify retention. Amazon’s Seller Central community description highlights that the dashboard analyzes customer retention and repeat purchase by brand and ASIN and shows metrics like overall orders, repeat ordered product sales, repeat ordered units, customer count, and repeat customer share (Amazon Seller Central forums).
How to interpret it:
- If repeat customer share is strong for one ASIN but weak for others, the product mix may be working against you.
- If repeat is dropping over time, investigate quality drift, competitor entry, or changes to the customer’s replenishment cadence.
- If repeat is flat but acquisition is rising, you may be buying growth that does not compound.
Turn repeat purchase signals into practical experiments
Repeat behavior is not just a report. It is a list of experiments:
- Replenishment clarity: update A+ content and images to clarify usage rate, pack size, and reorder timing.
- Bundle strategy: add multi-packs that match your best repeat cadence, like 60-day and 90-day options.
- Subscribe and Save readiness: if your product fits, improve your listing promise and inventory health first so customers are not disappointed.
- Post-purchase experience: packaging inserts and customer service responsiveness reduce returns and increase trust.
How to build a weekly Amazon customer analytics dashboard in 60 minutes
You do not need a BI tool to get started. A spreadsheet works. The real win is consistency: same metrics, same cadence, same decision owners.
Step 1: Pick a single view of “the week”
Choose a weekly period that matches your operations rhythm. Most brands pick Monday to Sunday. Then set a recurring calendar block to update the dashboard and review actions.
Step 2: Create one tab per funnel stage
Use a simple structure:
- Discovery tab: top search terms (Brand Analytics), Store sessions trend, ad impressions and clicks, Amazon Attribution clicks and DPV for external channels.
- Purchase tab: sessions, unit session percentage, ad CVR, ACOS, TACOS, and price changes.
- Repeat tab: repeat customer share, repeat sales, repeat units, and top repeat ASINs.
Step 3: Add three “diagnostic” ratios
Ratios show problems faster than raw totals:
- Click-through rate (CTR) for discovery relevance
- Detail page view rate for traffic quality (especially for external)
- Repeat customer share for brand compounding
Step 4: Add an action column and force decisions
Every row should have an owner and a next action. Examples:
- “Main image test on ASIN A, run for 14 days, compare CTR and unit session percentage.”
- “Split broad keywords into exact and phrase, cap bids until CVR recovers.”
- “Create 90-day multi-pack for replenishable SKU, test coupon vs no coupon.”
Common mistakes in Amazon customer analytics (and how to avoid them)
Mistake 1: Tracking everything except the decision
If you are exporting ten reports but not changing anything, your analytics is entertainment. Pick the few metrics that point to a specific fix.
Mistake 2: Treating fulfillment as separate from marketing
Delivery promises and inventory health are conversion levers. Slow delivery, stockouts, and inconsistent packaging experience will show up as weaker conversion and lower repeat, even if ads look fine. If you are scaling, your operations and marketing need one shared dashboard.
If you need help strengthening the operational side while you grow, review our ecommerce services and how we support brands with systems that keep performance stable at higher volume.
Mistake 3: Overreacting to week-to-week noise
Amazon is volatile. Use a rolling 4-week view alongside your weekly view. If you change bids, creative, and pricing all at once, you will not know what caused the result.
Mistake 4: Ignoring repeat purchases until the account “gets big”
Repeat purchase behavior is a leading indicator of whether your brand will be able to scale profitably. Even if you are small, track repeat customer share on your top ASINs. It will tell you whether you are building something durable.
A simple checklist: what to review every Monday
- Top 10 search terms and whether your click share is rising or falling
- Top 5 ASINs by sessions and unit session percentage changes
- Top campaigns by spend, ACOS, and new-to-brand share
- Amazon Attribution by channel: clicks, DPV, purchases, purchase rate
- Repeat Purchase Behavior: repeat customer share and repeat sales by ASIN
Need help turning Amazon data into a growth plan?
If you want a clearer view of what is driving growth, and a weekly operating rhythm that connects marketing to inventory and fulfillment, we can help. Get a free marketing analysis or reach out through our contact page and we will map the biggest opportunities in your funnel.